How to use stacked area chart
Here’s an example code regarding the use of stacked area chart:
dashboard "Example":
-
stacked area chart:
columns:
-
- "Apples"
- 3
- 2
- 3
- 4
- 2
-
- "Oranges"
- 2
- 1
- 0
- 1
- 1
-
- "Pears"
- 2
- 0
- 0
- 3
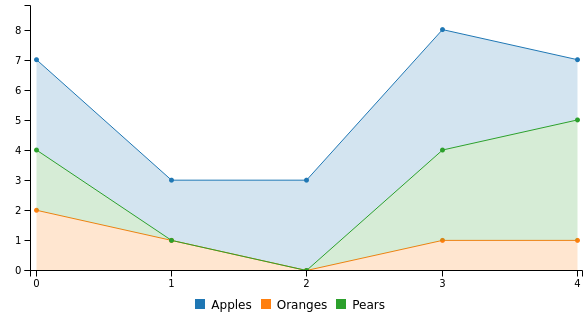
- 4
The code above will render a stacked area chart that looks like this:
JSON format
The YAML above is equivalent to this JSON:
{
  "component": "root",
  "args": {
    "title": "Example"
  },
  "data": [
    {
      "component": "chart",
      "args": {
        "type": "area",
        "stacked": true
      },
      "data": {
        "columns": [
          [
            "Apples",
            3,
            2,
            3,
            4,
            2
          ],
          [
            "Oranges",
            2,
            1,
            0,
            1,
            1
          ],
          [
            "Pears",
            2,
            0,
            0,
            3,
            4
          ]
        ]
      }
    }
  ]
}