How to use area chart
Here’s an example code regarding the use of area chart:
dashboard "Example":
-
area chart:
columns:
-
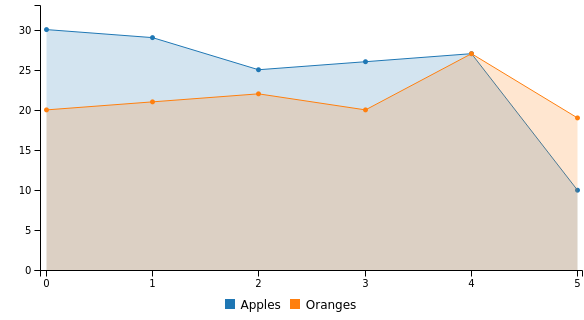
- "Apples"
- 30
- 29
- 25
- 26
- 27
- 10
-
- "Oranges"
- 20
- 21
- 22
- 20
- 27
- 19
The code above will render a area chart that looks like this:
JSON format
The YAML above is equivalent to this JSON:
{
  "component": "root",
  "args": {
    "title": "Example"
  },
  "data": [
    {
      "component": "chart",
      "args": {
        "type": "area",
        "stacked": false
      },
      "data": {
        "columns": [
          [
            "Apples",
            30,
            29,
            25,
            26,
            27,
            10
          ],
          [
            "Oranges",
            20,
            21,
            22,
            20,
            27,
            19
          ]
        ]
      }
    }
  ]
}